Artificial intelligence (AI) has become a major tool in the growth marketing arsenal, helping businesses drive growth and increase revenue. In fact, as the world has been introduced to consumer versions of AI through tools like ChatGPT recently, businesses have been using AI-powered campaigns and marketing channels for a long time. From TikTok video feeds to Facebook ad delivery, machine-learned targeting models have already seeped into our daily interactions and experiences on our phones and devices. Even Siri and Alexa (as primitive as they seem) voice assistants are deep learning TTS (text-to-speech) model rooted in AI technology. Businesses use AI-powered marketing rooted in machine learning algorithms to analyze user behavior and personalize marketing campaigns in real-time. This allows businesses to reach consumers more effectively and efficiently than ever before. However, as AI becomes increasingly prevalent in marketing, there are emerging pockets of ethical risks that potentially pose harm to you and me.
One of the leading concerns about AI-powered marketing is a tale that we’re all familiar with: the spreading of misinformation and fake news through AI-powered social media campaigns. AI algorithms can be easily manipulated to create fake news and spread false information to millions of people. According to a study by MIT Technology Review, false information spreads faster and more easily on social media than true information, which can have serious consequences for public opinion, trust, and democracy (MIT Technology Review, 2018). For example, the 2016 US Presidential election was influenced by AI-powered media campaigns on social media, which helped shape public opinion and ultimately influenced the outcome of the election (The Guardian, 2018).
Another area of concern is the manipulation of consumer behavior through AI-powered personalization. AI algorithms can track and analyze consumer behavior, including their browsing history, search history, and social media activity, to personalize marketing campaigns. While this can be a powerful tool for businesses to reach consumers more effectively, it also has the potential to exploit vulnerabilities and sway consumer behavior in potentially unintended ways. According to a report by the World Economic Forum, as AI algorithms become more advanced, they will have the potential to manipulate human behavior to a much greater extent, creating new risks for consumer welfare (World Economic Forum, 2021). For example, brands or organizations can use AI algorithms can be used to target vulnerable populations and exploit data to drive adoption or education, leading to negative consequences.
Big data could become another driving factor behind unethical practices in AI-powered growth marketing. AI algorithms are fed massive amounts of data to analyze consumer behavior and personalize marketing campaigns. According to a study by McKinsey & Company, big data analytics has the potential to generate significant value for businesses, but it also presents significant risks to privacy and security (McKinsey & Company, 2016). Vast quantities of data collected by algorithms can be easily manipulated to create false patterns and trends, leading to skewed results and unethical practices. Having worked in technology companies with access to large data sets, I know that there are several levels upon which data can be biased, both in how we determine which signals to track, how we define them, and ultimately how we interpret what the data is telling us. The scary thing is that we don’t fully realize that we’re making biased decisions, because we think the data is objective.
One could even see a world in which perfectly fine-tuned AI, which is based on mathematical models and algorithms that are designed to analyze and interpret patterns in data, can lead to a worse or more mediocre customer experience overall. These algorithms struggle to understand the complexity of human behavior and the context in which these behaviors occur. According to a report by Harvard Business Review, AI algorithms are still limited in their ability to understand human behavior and the context in which it occurs, which can lead to homogenous and generic experiences for consumers (Harvest Business Review, 2020). As a result, AI-powered growth marketing can create homogenous and generic experiences for consumers, ignoring important cultural and contextual factors that can influence consumer behavior. Imagine a world where every experience on the Internet is a 3.5-star Yelp restaurant one – homogenous, not too good nor too bad. Optimized right for the crowd.
To address these ethical concerns and limitations in AI-powered marketing, I believe that businesses must take a responsible and ethical approach. This might come in the from of more businesses putting ethical guidelines front and center, in addition to their terms of services. We need a cultural system (or even formal regulation) that can ensure the right incentives for transparency and accountability in AI-driven marketing campaigns, protect consumer privacy and data security, and create meaningful and respectful experiences for consumers. Our best bet will be to find the sweet spot in combining AI with human intuition and creativity, and then putting together the charter upfront for how these interact.
There is a lot of buzz around AI-driven marketing today. Tools like Jasper and ChatGPT have caused many go-to-market professionals to question whether their jobs will be replaced by robots in the near future. It can be unsettling to think about, but I’m also excited about the potential of these technologies to drastically improve our work and productivity. In my daily work, I’ve been able to use Jasper to quickly generate strategy statements and ad taglines with minimal input. It’s even helped me proofread parts of this write-up.
While this is all novel and exciting, AI-driven marketing is already making an impact on performance marketing channels. In fact, I’ve been using an ML-based performance ad channel over the last year in my role running growth at Descript, and these campaigns have broken our performance ceilings month after month. Let’s explore what’s happening now and how it affects our digital marketing and go-to-market decisions.
ML-based performance marketing is already here
Channels are all converging toward ML-based conversion optimization for targeting. Example: Google’s Performance Max campaigns; Facebook/Instagram’s broad targeting with conversion optimization campaigns
For those who aren’t familiar: Google Performance Max is a paid search campaign type that uses machine learning to optimize ad delivery and targeting in real-time, which results in achieving better performance and ROI outcomes. Instead of setting up targeting, you set up ‘”anti-targeting’” by telling the system what’s not considered a valid conversion.
ML-based targeting is ideal from the lens of ROI – the machine-learned system will most certainly be more precise in targeting and use each ad dollar in more effective way than human allocation could. But, it’s not ideal from the lens of gaining customer insights.
Perhaps in 6-12 months time, all paid search and paid social will utilize blackbox targeting where we don’t define or know who the platforms are targeting, except understanding broad filters geography, demographics, or platform, to name a few examples.
This creates a reliance on ads, where you can get a ton of results but you don’t know what drove its success and you can only count on the blackbox targeting system to continue working well.
A good parallel might be to understand what Amazon does with brands/sellers today. You pay Amazon to sell on your behalf, and the units sell or they don’t, but you don’t know who the customer is at the end of the day.
Overall, the Amazon-esque system can work incredibly well, but it rules out a certain type of seller that isn’t savvy enough to learn and exploit the system.
Skills for the future are technical and strategic
Performance marketing becomes a technical sport
Less focus on hiring those with ads operating experience, which tends to be the background of most junior performance marketers or agency hires. The things that performance marketers spend time on today, such as building the post, creating targeting parameters like frequency caps and daily budgets, setting up an a/b experiment, or optimizing based on results, will all become automated. Instead, people will spend more time defining clear optimization signals and structuring campaigns across these signals. Think of it almost as prompt creation.
Performance marketing as a whole will become a technically performant function where the operators behind the scenes will need to be data-minded in order to understand how utilize targeting and ranking mechanisms.
Instrumenting marketing data systems isn’t a common skillset for data engineers. That’s why the performance marketer will need to become an acting product manager to help ensure accurate instrumentation, and define a data taxonomy that becomes useful for marketing teams.
Content marketing and product marketing work requires more precise customer segmentation
It will be imperative to develop strengths across multiple niches in order to gain scale. Otherwise, we’ll hit the ceiling within the constraints of our economics – i.e. willingness to pay for a conversion – and time horizon.
More micro-targeted content positioned to the customer that will be likely to convert. This could mean developing more landing pages with focused content that gives greater chance of fitting into the blackbox targeting match.
Having a multi-faceted product that spans customer segments should play to our advantage in that it allows us to compete in multiple audience segments at one time, which increases our chances of exposure and conversion.
This increases our need to have a clear data-driven signal customer segments that can be exposed externally somehow.
The chasm between digital performance and brand marketing tactics will widen, yet the function of these are intertwined
Today, performance marketers look toward increasing reach as a mechanism to improve the likelihood of finding a converting audience. Tactics include bidding on a CPM basis to achieve a broader set of conversion outcomes. However, in the world of ML targeting, the system will reach as few users as possible to reach conversion objectives, which minimizes total reach and frequency of reach.
Brand and performance assets are thought of as separate entities right now, but these are becoming inseparable parts of the customer’s experience. For example, a user that is abruptly shown a use case landing page will most certainly want to explore the brand’s larger offering on the homepage or other branded pages (in my experience, this happens 20-30% of the time). Both types of pages will be relevant to cold prospects who are looking to learn about the brand while trying to get more information about their use cases. It’s about identifying the ideal navigation path and understanding what happens after a user interacts with a brand for the first time, or vice versa.
The bridge from brand marketing to performance marketing can be built via a multi-touch attribution model that companies either develop themselves by centralizing all data within a CDP like Segment, or they can be outsourced and imported to a 3rd party tool that does this for you, like Branch.
Preparing for the future means hiring for technical skills & building for channel-market fit
In a world of ML-driven customer acquisition, digital marketing teams must create clear signals and high-quality user experiences to be successful. This means that the better you perform today, the better you’ll perform tomorrow – it’s a performance flywheel. This wasn’t the case in the past, when performance marketing was limited by target audience ceilings and manual optimization decisions. The more signals you have, the better these platforms will be able to acquire new customers for you.
To accomplish this, you should hire ad managers from diverse backgrounds, with an emphasis on those with technical expertise. Content quality is still paramount for delivering persuasive messages that convert, but product marketing, content marketing, growth marketing, and product teams must work together to create a well-managed journey from first touch to product entry.
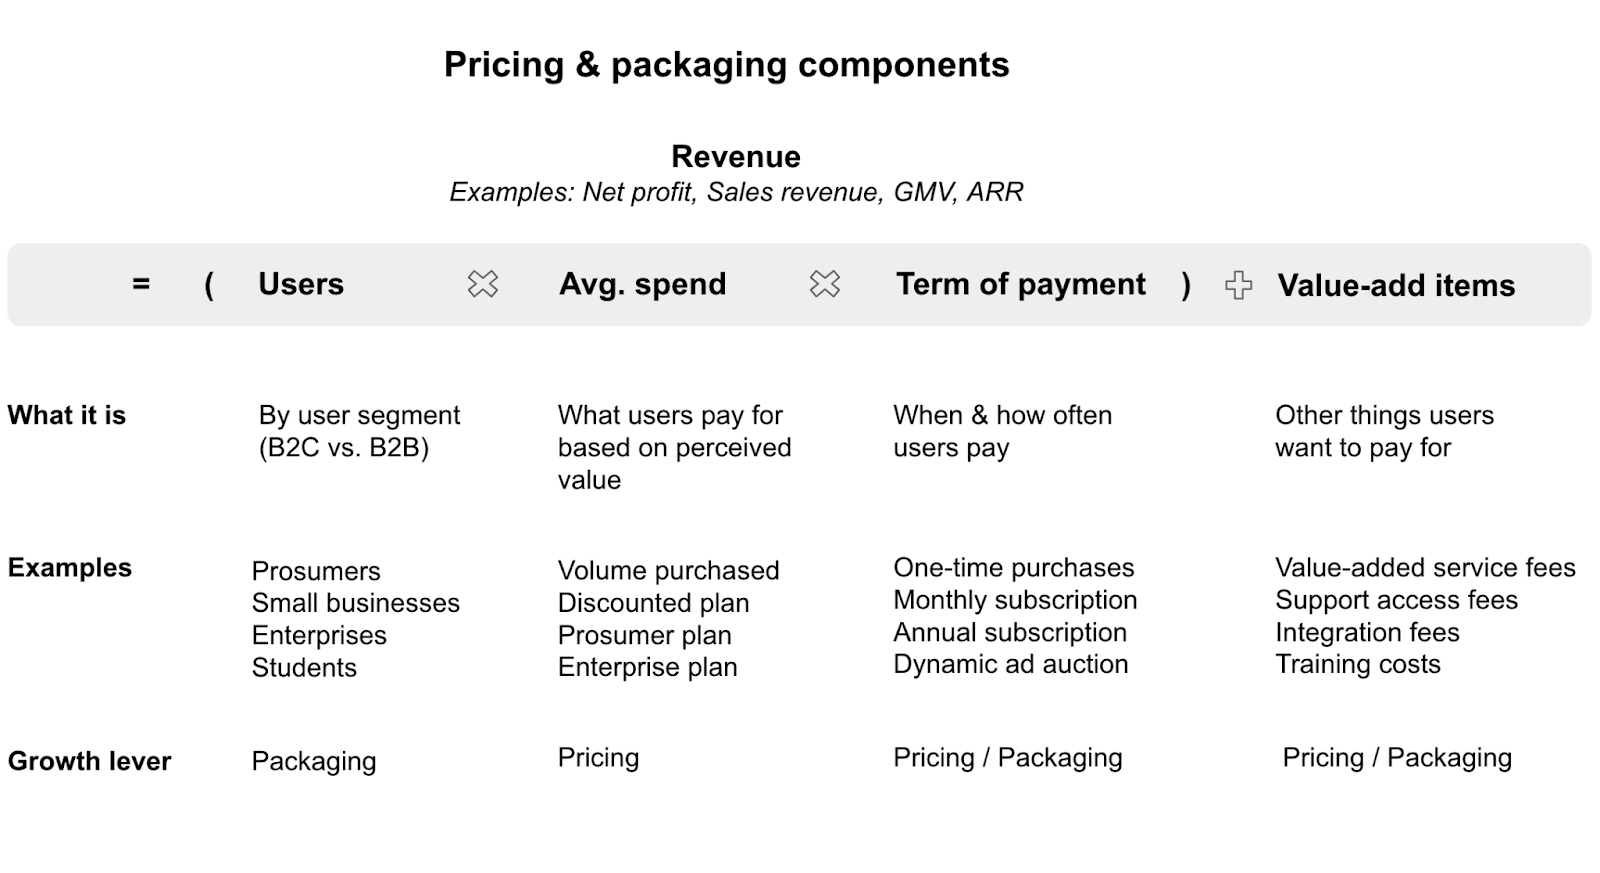
First, let’s understand: what is monetization? Monetization strategy refers to how a company decides to make money by offering its product or services to customers. This is a company deciding what they’re going to start charging users for them to use their products or services. Figuring out how you make money is tied in with what you’re naming it, when you charge, how often you charge, and how much it costs. For most software companies, revenue is the ultimate metric, and monetization is the strategy that touches revenue the deepest. The key reasons for a company to prioritize monetization strategy are:
Monetization allows companies to make money, which enables the team to reinvest into growth.
Monetization completes your product-market fit: it’s a reflection of your product’s positioning and packaging that ultimately allows you to build a sustainable and profitable business.
A focus on monetization strategy forces companiesto focus on growing the set of users with the highest ARPC.
Rather than cost cutting, monetization strategy is a lever for accelerating revenue through its compounding effects on acquisition and activation.
To grow a company, product and marketing teams will think about several strategies, including but not limited to common ones such as acquiring paid users, reducing product friction, and improving product retention. When it comes to revenue, it seems like sales alone is somehow responsible for numerical dollar amounts, and it can feel as if product and marketing will dust their hands and work on user and retention problems (often times as proxy or leading indicator) rather than directly on revenue ones.
For product teams, the first default tactic to impact the bottom line is often to “cut costs”. This is also true for marketing teams that track metrics like LTV:CAC, where after a 4-5 years, LTV rarely grows and instead we look to decrease the cost basis of the users we acquire. Product teams often look at the traction of their time investments and determine whether products and features are additive or detrimental – if the latter, we shut down the feature, or roll it back. If the product or feature is neither good or bad, then usually nothing happens and is handed over to sales and marketing to grow adoption. These are problematic perspectives that are miss the mark on distributing a product to an end customer. Ultimately, a user will purchase a product that they need if the price and packaging are right in their moment of need. Companies can inspire users to get to that moment, but for the most part, a product’s core job is to get users to that point.
Pricing strategies today – SaaS & enterprise
Pricing is a very relevant topic today, where companies need to adjust prices due to the rising costs of doing business as a result of decades-high inflation rates. Companies like Netflix or Beamer for example, have announced their price increases. Some of these companies are taking extra care to word their messages by addressing value-added features to justify the increases (Netflix explained that they are providing a lot more value through an extensive new collection of movies and TV shows). Yet others simply saying that their costs have risen and they need to increase prices as a result (Beamer announced that COGS have increased). Regardless of the circumstances, price changes will impact users in different ways, such as affecting the satisfaction of existing users or changing the perceived value of new potential users. Prices also affect how users perceive a company’s competitive positioning. In the examples above, companies expressed that their prices were forced due to broader economic conditions, and that they had no choice but to begrudgingly change. But while these example are driven by an increased cost basis, there are many benefits to thinking about pricing and packaging proactively relative to positioning.
In a world where user growth is typically seen as a proxy to revenue growth, there are many missed opportunities when it comes to driving growth through the components of monetization. Let’s break those down into the raw pricing and packaging components that a monetization strategy represents:
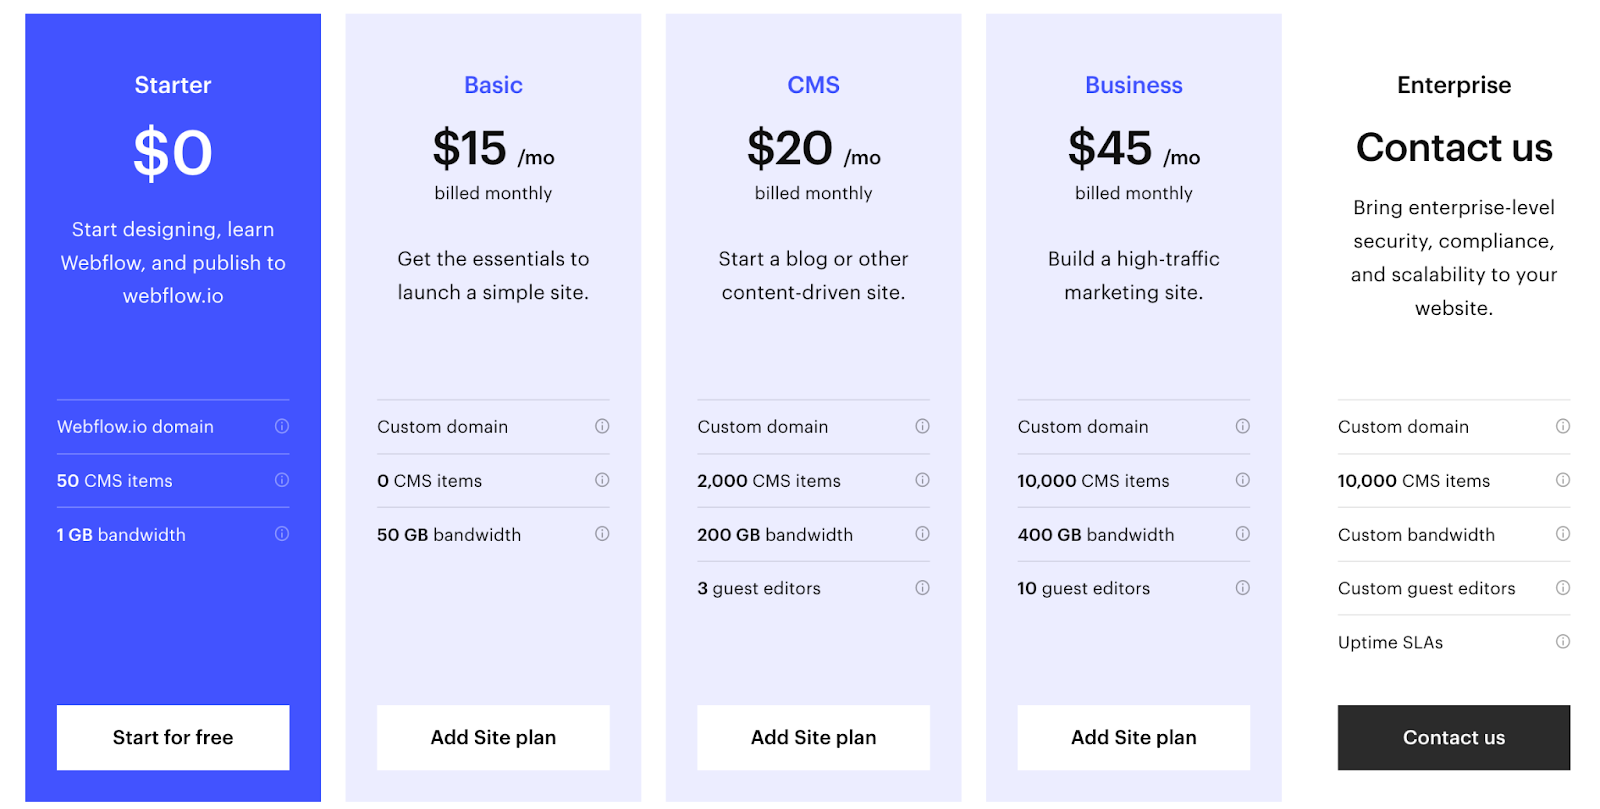
If we only rely on growing the # and composition of users to grow revenue, we missing out on a big part of our conversion engine. For example, what if your business only offered two plans today – one for consumers and the other for businesses, and you found out that the prosumers using your product were looking more for business-type features, but were paying for the consumer plan? That’s both money and potential users left on the table, so there’s a ton of value in exploring how you could create a separate package for your prosumer users. The company Webflow, a low-code website builder platform, does a great job of identifying several distinct segments of users that would want to pay to create a website. Though the monthly prices are each within a low range of prices, they individually speak to the specific type of customer who is looking to create a website through the tool – a blogger would look at the CMS plan, whereas a small business would start with the business plan, and someone who is just getting started and doesn’t have the need to collaborate with others or utilize scalable page types would go for the starter or Basic plan.
Why don’t companies use pricing as a growth lever?
While it makes sense that we would want to package appropriately for our target customer segments, there are still reasons why companies don’t prioritize monetization as a growth lever. Based on my experience working at large companies like Pinterest and Facebook, to smaller startups like Indiegogo and Descript, these are the key reasons why companies don’t prioritize pricing changes as a growth lever:
It seems customary to focus on getting customers first, then getting monetization right later. For many consumer companies, we’re trained to think of the goal as a hockey-stick shaped user growth curve. SaaS companies track ARR, but even then, revenue growth is driven by assuming changes in the number of paid seats rather than increasing revenue per user.
Pricing and packaging isn’t a typical skill set for anyone on product or growth teams – it feels like an abstract decision that is driven by experienced people.
Pricing changes aren’t easy to make. Not only are these changes deeply embedded within existing product flows, such as checkout experiences, feature gates, or pricing pages, they are also decisions that no single team can make alone. Changing prices also risks the satisfaction of your core customers, if you’re not doing it right.
Given the potential hurdles of getting buy-in from internal stakeholders such as the CEO, product and marketing leaders, to your own customers, updating your company’s pricing can be hard to get started. But the changes of a company having gotten pricing and packaging right on the first try is low, and particularly as a company is scaling its growth, there are many reasons that make pricing changes incredibly advantageous.
How do you build a monetization strategy for your product?
There’s an art and science to landing a monetization strategy. There’s no one-size-fits all strategy, even as a baseline, that will apply to the specific context of the product and market that you’re building for. The best thing to do is to start with the intuition you have for your customer set, and begin to validate it through experiments. Start with your own baseline and go from there. There’s no one else’s pricing strategy that you can copy and instantly become successful with (in fact, it can often be detrimental to just follow what your peers are doing without considering how it impacts your customers). That said, here are a few of the most important considerations for creating your baselines and experimenting from that point:
Monetization isn’t just price changes, it’s about positioning relative to your understanding of customer value and how your product delivers it. Think about how packages are separated, and make the decision points clear for customers. Your goal isn’t to confuse them on what they want, but rather to offer them a clear way to make a decision on how pricing scales value for their usage of your product.
Don’t bet all of your eggs in one basket, test changes where you can. Geographical or audience roll outs are a great way to test without disrupting the entire user base.
Don’t reengineer all of your product SKUs right out of the gate. Painted door tests are a way to get real reactions that mimic true conversion rates.
If unit economics / profitability don’t work yet, don’t rely solely on cost-cutting. Look toward pricing and packaging as a lever proactively, as it could change your COGS considerations.
Implementing a monetization strategy at your company
So then how do you know if you even have the right monetization strategy before you’re a prime candidate for pricing and packaging changes? The reality is that pricing and packaging is never going o be a decision made in a vacuum. Being at the bottom of the funnel, monetization strategies will see the compounded effects of acquisition and activation for better or for worse. You might be charging the wrong price or on the wrong value metric for the right customer, even if it gates access to the right thing.
Monetization is an incredibly interdisciplinary sport. In this topic alone, you’ll end up running through at least these functions:
Product marketing view of different segments.
Qualitative and quantitative research to run pricing surveys such as Max diff or conjoint analysis.
Data science-led pricing tests, with test vs. control audiences, a/b variants, or other tests of statistical significance.
Customer support management to manage new and existing user questions and sentiment.
Sales & marketing will need to update pricing and packaging messages across the website, emails, and in external publications.
Finance to work through implications of how it impacts bottom line and other company numbers.
Product and design to identify the right flows to introduce pricing and packaging.
Not only does pricing require a strong general manager skillset, it also requires driving alignment amongst many stakeholders. Monetization isn’t going to be as simple as one person’s decision – because it ties to revenue and product, it will likely require working with the CEO in earlier stage and growth stage companies. This will involve bringing data, customer insights, strategic insights, risk management, and more to the table just in the process of writing a proposal alone. Given the complexity of pushing through pricing changes, testing every change isn’t always possible. Sometimes, you just have to roll it out and see how it works. If it doesn’t work well, you can roll back as long as you’re transparent and keep your customers updated each step of the way.
I want to share a telling and formative story from my childhood. This is a story about how I was always just a single seat away from being concertmistress in my orchestra.
Concertmistress: noun.
a female leader of the first violins in a symphony orchestra, who is usually also the assistant to the conductor.
I attended Roosevelt Middle School in San Francisco. It was the first time I had to travel away from the Tenderloin neighborhood area in order to attend school (previously, my elementary school was half an hour’s walk away) and got me venturing deep into the Richmond District. The way that classes worked was, there were certain required courses that you were assigned, say, math and language arts, but there were also electives. Without fully understanding exactly what those electives entailed, I signed up for the Symphonic Orchestra elective. Little would I know that this choice would shape my mindset so dramatically for years to come.
I started my first day of school bright and early, and I walked into Symphonic Orchestra which took place every morning for an hour starting at 7AM. The conductor, Mr. Jones, was a teacher who seemed stern yet soft-hearted, and he asked us all to grab the proper violin size from the lockers. While I was digging around for a suitable violin, I looked around at my classmates who appeared to be upperclassmen and upperclasswomen, as they were noticeably more charming in their conversations amongst each other and appeared to be confident in their instrument selection. At this point, I had only dabbled with violin during group classes in elementary school, as part of a music program that was lightly funded and focused on recreation more than actual music practice. As you can imagine, I became incredibly nervous at the fact that I was clearly younger, less experienced, and likely not as good of a violin player compared to my other classmates.
The conductor proceeded to seat some of the upper classmates based on his familiarity with their skill level, sorting us all into specific seating arrangements across first violin, second violin, viola, cell, bass, winds, brass, and percussion. Given that I was new and visibly mishandling the instrument, he seated me toward the back of the second violin section. He then passed around folders with sheet music and proceeded with a group tuning exercise. I was horrified looking around at my classmates tuning their instruments with such ease, but I intended to hide my anxiety and mimicked the gestures of the classmate next to me, by raising my violin up to my chin and fiddling around with the tuners. Luckily, I was able to grasp that twisting the tuner in one direction led to an increased sharpness in the pitch, and was able to get the violin tuned in sync with the group.
We pulled up the sheet music that we were going to play for that day, and upon looking at the sheet with lines and dots, I began to panic with a sweaty brow given that I did not know how to read sheet music. There was no time wasted as the conductor raised his baton and cued us all to start at the top of the piece. At this point, my survival instincts kicked in and all I could do was mimic the bow directions of the person next to me, gliding my bow in the air right above the string or pressing so lightly that no sound could be made. I somehow managed to pull this off for an hour going unnoticed, and by the end of the class, fooled the conductor and my stand partner into believing that I had been playing music the entire time. But while I got away for the first day, I knew I couldn’t go on fooling them for long. The best course of action would be to tell the instructor that I wanted to drop the course and register for the beginner level orchestra. But that was not a satisfying solution, and something within me told me to persist with the current class.
On the second day of symphonic orchestra, I got back into my actress mode and feigned playing violin once again. This time was different – after piecing together some annotations for finger positions on the score, with the sounds I was creating, and matching open strings with the dots on the page, musical notation suddenly made sense to me all at once. By the end of the class, I was following along and reading the music as quickly as the violinists around me. And by the end of the week, I was playing loudly and confidently. There were still confusing aspects of the sheet music, such as key signature, and in those situations I would listen to the relative ‘flatness’ or ‘sharpness’ of the music being played and mimic those sounds. I found a system that would work for me and was so excited to play even more music.
This went on for a month, and everyday I would learn something new about either reading musical scores or improving my violin technique. At the end of the second month, something unexpected happened: the conductor advanced me to the first stand of the second violin section. I was horrified and proud at the same time. I had practiced regularly at home and focused so much on improving that I could even play some of the more difficult passages, and often found that I could confidently play some of the harder passages with ease, whereas other classmates would play much quieter during the difficult parts. At this point, I told myself that I could not fake it any longer: I must improve. This led to me spending weekends at the library borrowing musical scores, VHS tapes, CDs, and violin books, where I could learn how to improve my skills as much as I could.
Symphonic orchestra filled my mornings with joy. I felt such a rush of excitement at the idea of being able to choose what I wanted to do (in this case, it was to play music), put dedicated effort towards it, and achieve visible progress (based on seating positions in the orchestra). It gave me a feeling of confidence that I had never experienced as a child, and I felt that I could be “good” at something for the first time. Half a year later, I was seated next to the concertmistress, a seat away from the top seat in the orchestra. I was so pleased with my progress and genuinely loved the music that I played. I did not know that, for the remainder of my middle school years, this would remain my seat and I would advance no further.
The concertmistress who took the coveted seat was both a friend and an amazing musician. She had practiced violin since she was in elementary school under the guidance of a private instructor. She was a musical prodigy when you considered her advanced techniques and sheer musicality, that I knew clearly exceeded my own skills in every possible way. Still, I gave myself permission to be ambitious and to learn to play as well as she could. Initially, this ambition was motivating and brought me great joy in my practice. As time passed, and I couldn’t see visible progress toward getting the concertmistress seat, I became disheartened, and violin practice seemed more and more like a chore.
Eventually, this bred within me a desire to prove myself without the help of others. I was both envious and resentful of other students who received any type of private instruction or help. My family was not financially positioned to hire a private music teacher, nor could I afford to buy a violin. I borrowed the school violin and practiced whenever I could, but during summers I was left without an instrument and felt saddened that my life situation left me this way. With those feelings deeply etched into my heart, so resulted my lifelong struggle to ask others for help, as from then on I felt that this battle was a tough and lonely one.
By the end of middle school, I continued to sit next to the concertmistress, and while I learned a lot from watching her play, I always carried a heavy burden in my heart. I promised myself that if I could make my own money someday, I would never spend it on a teacher. Instead, I would be as self-sufficient and resourceful as I could be, and would never succumb to the privileged methods that others used. This led to a toxic mindset as I transitioned into high school, which was even more challenging when it came to coursework and social relationships. I ended up suffering a bout of depression and mental illness towards the end of high school, which weakened me physically as well.
Moving into college, I came to see that my ways of thinking were wrong. This was thanks to the kind and giving people I met, the mentors and friends who were willing to wait for me, help me, give me things without expecting or wanting anything in return. From then on, my mindset shifted, and I began to open to others about my struggles. Still, I often felt myself being in the position of second chair, whether it was in regards to internship offers, exam grades, social influence, and the like. I never got the coveted concertmistress seat, and it felt unfair. During those moments, I would recede back into my self-pitying mindset to avoid the help of others. Then, friends and mentors would reach out and break past that barrier with me, and I could accept the help of others and succeed as a result. It was a hard transition for me, and I’m still working on it even today.
This started as a story about my childhood, but it’s actually a thank you note for my mentors who showed me so much compassion and kindness. Mr. Jones who conducted my orchestra surely belongs in that list, and I’m sure that I didn’t actually fool him into thinking I was playing violin that first day. He saw my progress and gave me the chance of a lifetime, and the never-ending gift of love for music. To all of my other mentors, thank you for continuing to give and share (even if I feel that I don’t deserve it sometimes). Thank you for changing the course of my life.
Are you studying a foreign language, such as Chinese, Japanese, Korean, French, etc., and want an easier way to quiz yourself? Look no further, I’ve written a Python flashcards program that cuts through all of the complex designs and ads so you can study locally on your computer in peace.
Flash Cards Python Program Demo
Download Python and CSV files
I’ve included the Python script here. You’ll be directed to Google Drive, where you’ll be able to safely down the .py file. I’ve also included a CSV template sample so you can ensure that you’re using the right headings to run the code.
For whatever reason, you may be looking to backup, download, or export your WeChat (微信)files, chat logs, or contacts. After scouring the Internet for hours, I wasn’t able to find comprehensive tutorials for my needs, so I decided to pull together these step-by-step instructions to help those who are facing similar problems. Without further ado, here are the best ways I found to backup my WeChat profile data:
3 Ways to Backup WeChat Data
For chat history and files: Use WeChat’s PC App or Mac Desktop App to store logs on computer (for device to device transfer only)
For chat history, files, contacts, or moments: Request personal data backup files (EU, US only)
For chat history and files: Use third party desktop apps
For chat history and files: Use Wechat’s PC/Mac Desktop App to store logs on computer (for device to device transfer only)
Time: 15 minutes+, depending on how much chat history and file data you have Preparation: Laptop (WeChat PC or Mac Desktop App), Phone (iOS or Android WeChat App) Cost: Free
Go to Wechat’s official site to download the Mac or Windows version of the Desktop app.
Open the Desktop App and scan with your WeChat phone App to log in.
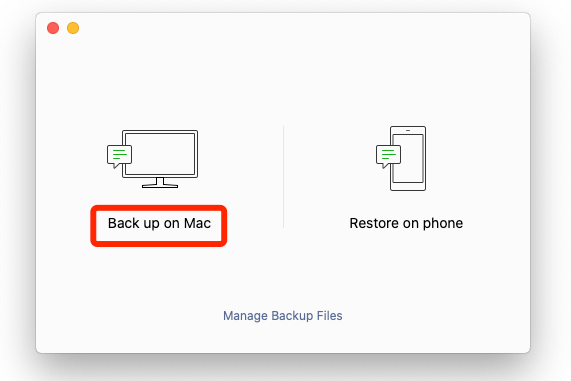
4. Once you’ve logged in, find the menu icon at the bottom left corner and click ‘Backup and Restore’.
5. Choose ‘Back up on Mac’ to store the files within the Desktop app on your computer.
6. Take out your Phone and follow on-screen guidance to ‘Backup All’, or select specific chat records that you want to save. This process will take you anywhere from a few minutes to hours, depending on how much data your chat logs have (i.e. image files, large attachments, etc). Keep both the computer and phone Apps open the entire time, or else the backup process will pause.
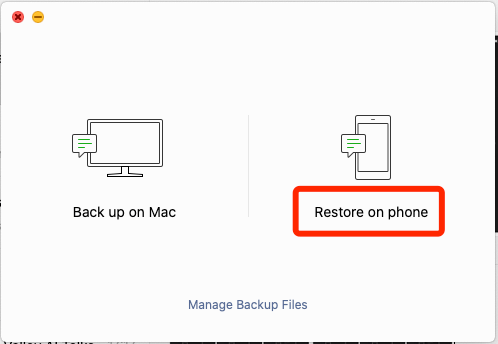
7. That’s it! The data is now stored on your Desktop WeChat. When you need to restore this data to a new phone or mobile device, just log in to the Desktop App, go into ‘Backup and Restore’ and choose ‘Restore on Phone’.
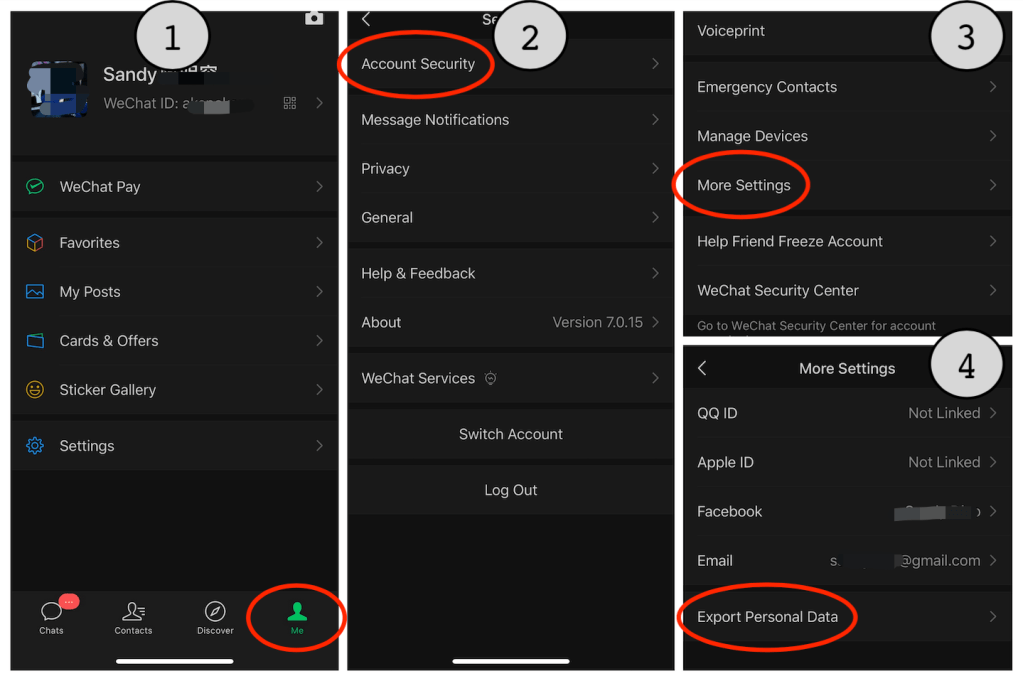
For chat history, files, contacts, or moments: Request personal data backup files (EU, US only)
Time: 10-15 minutes Preparation: Phone only (iOS or Android WeChat App) Cost: Free
Open your iOS or Android WeChat App
Go to ‘Me’ → ‘Settings’ → ‘More Settings’ → ‘Export Personal Data’
3. You’ll meet one of two scenarios:
A) If you haven’t linked your Wechat to an email address, you’ll need to verify your email first before you can request a personal data export:
B) If you’ve already linked and verified an email address, click ‘OK’ to begin the data request process. IMPORTANT: Do not close this Wechat window – minimize the App to check your email, and then come back to this screen. The email verification must happen while this window is running. If you click out of this screen, you’ll have to start the process over again. You’ll receive the verification email in your inbox about 2-5 minutes later.
After you click ‘OK’ in the email and see the success screen, go back to the App, where you’ll see that your email was successfully verified. Click ‘Next’.
4. Select which data types you want to export. Hit ‘Next’ to begin the data request process.
5. You’re done! Depending on how large the data file is, it can take up to 72 hours to receive an email with the data download link. You’ll need to open the email on your Desktop, and the download link will expire in 72 hours from the time it was generated. Note that the downloaded data is all stored in (.js) extension files, so you’ll need a way to parse through that.
Wechat data page must be opened in a Desktop browser to download.
For chat history and files: Use third party desktop Apps for backup
Time: 30 minutes or more Preparation: Laptop, Phone Cost: Depends on App (Free, $10-$50 is the typical range I’ve seen)
Of the three featured backup methods, this is the least consistently effective one. There are dozens of third-party software providers out there that claim to backup Wechat files, but depending on whether the original developers have updated their software, version compatibility, and many other reasons, the experience will be less reliable. Do your research prior to purchasing and make sure that other users can vouch for a positive experience (you can do by searching for user reviews on Google, Reddit, etc). I do not endorse any of the following options, but am laying out some options that I came across in my research:
MobileTrans – Backup Wechat history and account contacts to a PC before transferring to another mobile device. The same developers also created dr.fone, which offers similar functionality on their website.
iCloud – Backup your iPhone (for iOS users) including WeChat data, and you’ll be able to reinstate all of your chat history and contacts after you log into iCloud on a different mobile device.
Anything else?
That’s it! I hope one of the methods above worked for you. If not, do not fret – there are alternative (but less straight forward) ways to backup your data, including several that require reading the Chinese language. If none of the above worked for you, send me a message and I’ll help recommend an alternative solution.
Since the inception of the first smartphone IBM Simon in 1992, mobile phone hardware has been shaped by our content needs in computing, firstly with processing chips for email and news. A decade later, mobile phone hardware saw its first built-in camera. Smartphone hardware has always been playing a catch-up game with the content consumption use cases stemming from personal computing devices, such as laptops, cameras, and music players. Today, we’re seeing a different dynamic.
As of last year, smartphone penetration reached a third of the world, and now these users are shaping their habits around the phones themselves. When you pull out your smartphone to shoot a video, do you find yourself shooting vertically, or do you flip the phone 90-degrees to a landscape orientation? Five years ago, you might have turned the phone on its side. Nowadays, vertical video is a popular and immerse format that fully utilizes the display of your smartphone.
Alongside the smartphone hardware itself, other industry developments create a set of parameters that shape how we think about content – from 4G networks, graphics display resolution, computing chip power, thin yet powerful batteries, to GPS functionality, and more. This system now beckons content creators to shape their content around these systems – here are a few examples of how this is being done.
Mobile-first layout: the vertical 9:16 video
The cinematic, horizontal video we have known for more than a century is being flipped on its side, literally. Vertical, or portrait content captured in 9:16 aspect ratio, is a native format popularized by platforms such as Snapchat, Instagram Stories, IGTV, TikTok (formerly Musical.ly), and YouTube. Created to match the viewing and shooting orientation of smartphones, the vertical video has shown to drive higher user engagement metrics. This format is favored by mobile users who can experience clear and zoomed-in videos filled edge-to-edge on 4.7 to 5.5 inch displays.
Emerging 360-degree formats still require special software and hardware
Consumer 360 cameras for as low as $100 make it accessible for consumers to shoot videos that capture everything around them. Given the lack of file format support on smartphones, content creators must shoot and edit content with the end distribution platform in mind. For example, a creator looking to post to YouTube will need to modify the file before uploading. Given that most users do not own a virtual reality headset, most 360-degree video content must be offered in 2D, which creators must keep in mind for video aesthetics.
Augmented reality is simplified for your smartphone
While smartphone cameras are powerful enough to enable augmented reality experiences through apps running Apple’s ARKit or Google’s Android ARCore, they still lack the processing power of standalone AR hardware. Standalone headsets have the multi-cameras, sensors, and dedicated computing that enables more responsive gameplay and advanced content interactions. For now, given that smartphones are well adopted by consumers, developers are starting with the mobile platform to offer lightweight experiences such as gaming with Pokemon Go, and useful utility apps like iOS Measure.
Rise of the home-produced video as the standard
The film “Searching” by Aneesh Chaganty is a full-screen Hollywood production that mimics the look and feel of an iPhone-shot video in its clips where the protagonist is in front of the computer and communicating with other characters via mobile. In an attempt to match the aesthetic of what mobile users are familiar with, content creators from Johnson & Johnson to your favorite YouTube influencer will want their content to feel realistic and genuine, which means they will shoot in native mobile.
What’s Next
While our cameras shoot in ultra-high resolution and sky high frames-per-second, most smartphone displays will playback in 720P to 1080P. Hardware is quickly changing to meet these needs, as some newer models of smartphones such as Sony’s Xperia Z5. However, these gains will be marginally incremental in the coming years. Each year with the release of new iPhones, we’ll see fewer giant leaps in performance gains, but instead, we see hybrid innovation from the content ecosystems themselves. Perhaps holographic 3D displays aren’t too far off, and our favorite content creators will follow suit to match with innovative content.
This essay originally appeared in Hardware Massive Resources.
2018 is a hot year for hardware. It’s not just Apple trying to get products into every household anymore–web giants including Amazon, Google, Baidu, and others, have put out personal computing devices into our hands so that we can spend more time engaging with their ecosystems. In the past year and a half at Indiegogo, I’ve seen companies building at the cusp of this industry change. I’ve helped over 200 hardware startups strategize their go-to-market and raise over $30 million dollars through crowdfunding campaigns.
There are a lot of pioneering industries out there, with the tokenization of business utilities being one of the hottest by measure of financial value created. Yet, I believe that blockchain is not necessary the solution that helps consumers to different services and platforms out there. Payments currency, for instance, theoretically benefits from blockchain implementation, but consumer adoption and day-to-day acts of transacting in the real world is another story.
When we thought about IoT three years ago, it seemed we were better off without the “Internet”, because this involved a lot of work building your own “community” or “app” to provide robust user experiences. An example is Tile, a tracking device company that needed to garnered millions of users in a user’s network to crowdsource finding lost items. For consumers, it meant installing separate apps and clicking 3-steps into tucked away menus to control different light bulbs in the house. This was the seemingly hard-to-scale and hard-to-adopt IoT vision of the past.
Today’s computing devices are taking the form of consumer hardware around us, which opens up new opportunities for companies to build out these passive computing systems. We’re already slowing seeping into a world of passive computing, through smart speakers, voice A.I assistants, and smartphones in the palm of our hands. Previously, we were only able to tap into the utilities of the Internet while we were actively browsing a computer. Now, we are connected to the Internet through devices everywhere around us, and it allows us to tap into an infinite amount of resources that expand what is possible in our time not interacting with a computer of the traditional sense. This can be as simple as video doorbells that allows you to check for packages while you’re away on vacation, to a smart speakers that you can command to buy toilet paper while you’re cooking in the kitchen. In the past few years, we were sharing with consumer a vision of what is possible through passive computing, such as using a Fitbit wearable wristband to measure real-time performance data and receive notifications. Hence, declarative statements such as “IoT is dead” or “Wearables is dead” misrepresents what wearables can promise to consumers. In fact, it is estimated that over 115 million units* of wearables were distributed worldwide in 2017, making it one of the most lucrative categories out there.
Pictured: Apple Watch with number of steps and total exercise time tracked and displayed. *Source: IDC’s “Worldwide Quarterly Wearable Device Tracker” report, March 2018.
Speaking of which, we’ve heard since the CES Las Vegas show this year that “Consumer hardware is dead.” However, I believe that there has been no better time since the inception of the personal computer for companies to take advantage of the ecosystems that are shaping up relative to our daily habits. Everything from wider-ranging cellular networks, to faster Internet speeds, to accessible developer platforms, have converged in this year to truly open up more consumer-facing opportunities, These include searching for things on the web, capturing moments around us with cameras, safely entering and leaving our homes, and even driving our cars. The web giants who were able to drive behavioral adoption for miniscule tasks in our lives, such as Google calendaring, setting iPhone alarms, curating our exact tastes in music through Spotify playlists, and so forth, have created infinite possibilities for companies to come in and create workflows for us. As a company building a music streaming app such as Spotify, or one that is building a hi-fidelity speaker, there is an entry point into this ecosystem to drive adoption like never before. It’s no wonder that companies with million-plus users are figuring out how to extend their applications to other areas in their customer’s live beyond their time spent actively browsing the web. This year, we’ll see Samsung, Microsoft, Facebook, Snapchat, and more, decide how to extend our time spent engaging with their services, by offering spurts of value in different areas in our lives.
You’ve likely already read and understood the mainstream predictions for hardware this year, namely surrounding industries such as augmented reality, virtual reality, robotics, artificial intelligence, and more. In addition to those, I’d like to share my own predictions:
1. Bigger (yet smaller-sized), better, flexible, and wireless power.
Until now, lithium-ion batteries have powered everything around us, from our MacBook Pros to our Anker portable power banks, and I don’t see this changing quite yet. Alternative power sources are in development, but we’re not yet close to a consumer-level power substitute that is as efficient, safe, and powerful. However, we’re on the horizon of monumental gains in the size-to-capacity ratio, battery management systems, and power output speeds. The form factor is prime for experimentation and change, as consumers are tired of breaking, changing, and getting entangled by charging cables. Wearable electronics will be overhauled with the possibility using flexible and extra thin batteries, which was not available in the past.
Pictured: Omni 20 USB-C Power Bank, supporting USB-C 60W output and data transfer in a small body.
2. Personal entertainment brought to a whole new level.
Large screen cinema can be brought to micro-LED TV displays, or enlarged in crisp 4K through smart projectors that allow us to access Hulu, Netflix, YouTube and more. In fact, we’re even seeing growing interest in pocket-sized cinema headsets, which allows you to view videos entirely in private, anywhere you are. High-fidelity, surround sound that fills a room can be packed into a small speaker that operates wirelessly. We’re not limited to streaming movies through our mini-screen computers anymore, and I’m excited to see projections and holograms take a greater role in replaying life-like content.
Pictured: Shenzhen-based GOOVIS launched a headset with a built-in 4K resolution display.
3. Bridging the old with the new in automobiles and last mile vehicles.
Even with the promise of autonomously driving vehicles that can support hands-free driving in the foreseeable future, people are still glued to their 5-to-10-year-old cars. In addition, cars aren’t the only way to get to work anymore. Powerful electric skateboards with four-wheel drive can propel us up San Francisco hills, and city-shared commuter bikes can be rented without worry of parking security. Daily commuters in urban cities are seeking new solutions, whether it be hoverboards, electric bikes, or smart car devices that can help track, upkeep, and improve our automobiles.
Pictured: Ofo is a bike-sharing service that allows daily commuters to borrow bikes for short distances using an app. Users aren’t required to return the bikes to specific parking locations.
4. Growing ecosystems need hardware to activate experiences.
Large companies like Amazon and Google continue to build their platforms that allow new companies across software and hardware to introduce new experiences to customers. For example, Muse is a Bluetooth device that affixes to your car vent, so you can transform your car into a voice activated assistant. Without Alexa, this product would require much more user education and time spent on developing in-house artificial intelligence technologies. These ecosystems present a new, viable exit opportunity for companies based in hardware, as these new utilities will be valued greatly by the ecosystem owners. Whether it’s Amazon Alexa, Google Home, Baidu DuerOS, Samsung Bixby, or Microsoft Cortana, these are just some of ecosystems that can help you access new customers in different settings. Pictured: Google Home Mini uses Google Assistant voice-controlled A.I. to help you accomplish tasks such as checking the weather, playing music, and more.
5. Cameras and video capturing devices that can powerfully compute for specific content needs.
Through content creation platforms such as YouTube, Snapchat, and Instagram, we’ll be live streaming, video blogging, and spontaneous capturing moments of our lives when we’re not actively filming through our smartphones. While smartphone cameras are becoming more powerful than our standalone point-and-shoot cameras, these will still primarily serve mass consumer use cases. Specific content creation tasks require different types of devices, such as high point-of-view landscape photography by drones, Facebook Live streaming by 360-degree cameras, action sports by rugged, high-frame rate camcorders, and more. Improved sensors and digital processing allow us to enter a new world of videography and photography, helping us to bypass limitations on lighting, action scenes, environment, and more.
Pictured: DJI Mavic Pro can fly 500 meters above ground level to capture landscape photos and footage.
6. Internationalization of consumer hardware teams.
Google needs a team to help build their consumer hardware platform. Snapchat is inexperienced in manufacturing and needs to offer a sub-$100 product to their majority younger users. The world’s electronics manufacturing centers, knowledge, and talent still lie in cities like Shenzhen and Taipei. There’s no skirting past this lack of expertise here in the United States, so we’re going to see more cross-border teams who can complement each other in areas such as manufacturing, product development, logistics, and design, to name a few.
Pictured: Panel at Techcrunch Disrupt in Shenzhen, featuring cross-border hardware teams led by American and Chinese founders.
The appearance of stagnant investment portfolios for consumer hardware companies in 2017 does not alarm me yet. In the early stages of building an industry, there will always be winners and losers. A decline in the number of consumer hardware companies is not a bad thing. If anything, the past two years have helped the industry weed out the companies who were not ready to deliver a hardware product, a task that comes with its own manufacturing, design, and marketing challenges. I’m excited to see 2018 become a springboard for new solutions delivered to us through the form of consumer hardware.
This essay originally appeared on Hardware Massive Resources.
5 steps to building your first website sales forecast
Traditional sales forecasts are based on historical data and can be rather complex given different product types. These forecast models are based on “growth rates” that calculate a percentage change over time. If you’re a hardware startup launching a single product, you may find that you have no historical data to use for making assumptions.
In my experience working with over 250 hardware startups at Indiegogo, I’ve found that there is one thing that all hardware startups are doing as they’re building up their sales: digital marketing. Through Facebook ads or other types of digital marketing activities, companies are using direct response marketing to drive visitors to their ecommerce websites in order to drive more sales. Aside from one-off promotional activities or traffic spikes from visibility in the media, there are two things that don’t change drastically from day to day, and that is your website traffic and the conversion rate on your page. The conversion rate refers to the total number of people who purchase a product out of everyone who visited your website.
For hardware startups trying to estimate future sales and establish a plan to continue to grow, I have found that the number of qualified visitors you drive to your checkout page is one of the most accurate ways to determine how much more sales you could potentially drive.
Example: Let’s say you’re currently driving 1,000 visitors to your page, and you manage to convert 1% of them into paying customers – that would be 10 purchases per day. Assuming that you need to sell 20 units per day, you would try to double the traffic you get–that means 2,000 visitors–to acquire 20 paying customers. This is a sign to your team that you need to increase the traffic to your page, or improve the conversion rate by optimizing your page and converting more sales for each ad dollar you spend. You need to start tracking this information in order to understand where you can improve your sales pipeline.
In this forecast, I use a page conversion rate instead of a “growth rate,” which is the more common underlying metric in forecasts. This is because hardware sales are prone to more nuanced data anomalies compared to software or service businesses. Selling 100,000 units in one month does not mean that you will be able to sustain the same volume going into the next month, nor is it helpful to reference during the same period the following year. With these differences in mind, let’s start by understanding the goal of creating a sales forecast.
What is a sales forecast?
A sales forecast is a spreadsheet that you can use to estimate future sales for your company. You can make it as short-term or long-term as you want, and include or exclude as much details as you need. A forecast will help you explain the assumptions behind your valuation to investors, and help you rally for budget for specific initiatives. Even if you’re not presenting a deck to your board soon, it’s important to keep an up-to-date forecast to understand how well you’re trending against your goals.
The goal of this tutorial is to help you build a forecast for your website sales in a single month, so that you have a sheet to track your daily sales with. This template will apply best to startups who don’t have any data, and therefore marketing performance is the best data set you have to build your forecast. At some point you’ll have a fancy, color-coded financial projection spreadsheet. But, for first-timers, I strongly recommend building a forecast that is easy to understand and update, so that you can easily look at it at any point in time to assess business decisions. The best forecasts are made bottoms-up, which means that you calculate any projection trends based on actual sales and results, so it can accurately reflect your business’ unique operations. There is little benefit to running a tops-down forecast when you’re trying to assess actual business numbers.
Example: Tops-down forecasting means to identify the total size of the market, and assume that you will capture any percent of it. You could say that the total size of the market in 2017 was $1 billion, and capturing 1% of the market would yield $10 million in sales for your company in the first year. Without any marketing activities and actual customers, you will capture none of the market, so showing any investor a tops-down forecast is not grounded in reality.
A small set of historical data, a goal, and Excel (or a cloud-based spreadsheet solution like Google Sheets) are all you need to get started. I recommend starting with Google Sheets so that you can update and share with team members at any point in time.
Before we get started, I want to point out that there are no rules for creating a sales forecast. This tutorial is only one variation and tackles a very specific goal.
Don’t edit anything in this template–go to “File”–>”Make a Copy” and edit your own version. On your own version, you’re welcome to make any changes to this outline and use this as your own.
Cells in yellow are ones you will need to fill out.
Cells in grey are anchored formulas, so you should not edit these.
Cells in blue are summations, and are used to emphasize total amounts.
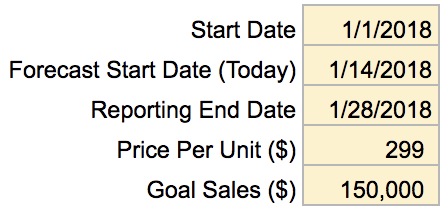
STEP 1: Determine your reporting period, product price, and goal.
Start Date: Date when your company’s reporting period starts. A common way to track this would be from the start of a quarter to the end.
Forecast Start Date: Once you have at least two weeks of sales, you can start to make this forecast. This is the date in which you’re sitting down to make this forecast.
Reporting End Date: The end of your reporting period–many companies will set this as the end of the quarter. In this example, I set the end of a 4-week period to calculate a month.
Price Per Unit: This number will help us calculate the total sales amount.
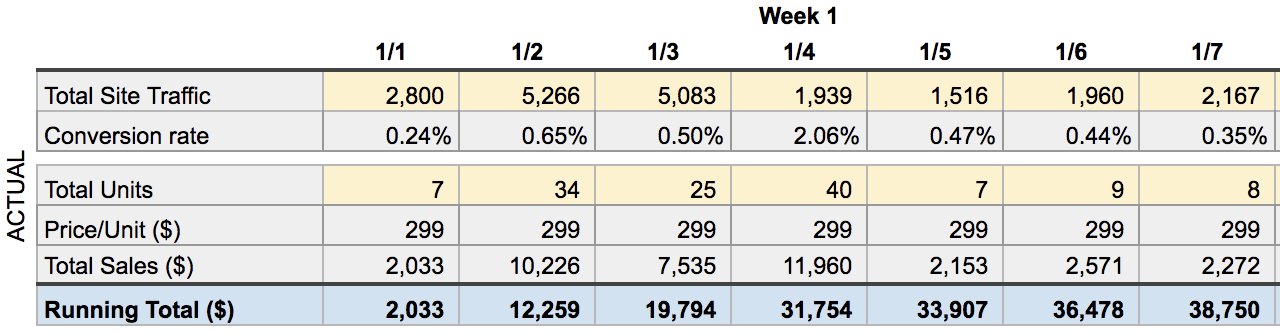
STEP 2: Lay out your historical data, which are the units you’ve actually sold.
Total Site Traffic: Use your site analytics tool to track how much traffic you’re driving to the page.
Conversion rate: Divide the Total Units / Total Site Traffic so that you can calculate a conversion rate. Depending on the channel you’re selling in, this conversion rate will be different. As a general benchmark, if your page conversion rate is below 1.0%, then you should look out for ways to improve the user checkout experience or your page content.
Total Units: How many products you sell per day.
Price/Unit: This field is carried over from your product price set in Step 1. You can override these fields if you have sales on specific dates and lower your price point.
Total Sales: Total Units x Price/Unit ($)
Running Total: This is the cumulative sum of your total sales since the start of the reporting period. In order words, this is a snapshot view of how much your total sales are on a specific date.
STEP 3: Calculate your “run rates”, which is how you’re trending.
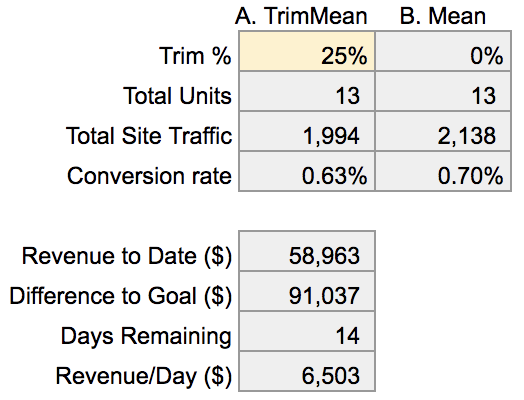
This is the part where it becomes less of a template, and requires you to think about your business. You’ll need to pick whether which set of performance data you want to use to project future sales with. Based on your historical data, I’ve calculated two averages here:
=TrimMean(): An average that removes the top 25 data points so you can exclude any outlier data that does not represent the rest of the data well. For example: In Week 1, we had a day where the page conversion rate was 2.06%, and we drove over $11,960 in sales. This was because a partner put in a larger order and is not a repeatable sales event, so we want to exclude it. Using the TrimMean helps us remove data points like this so that our average trend numbers are more accurate in our forecast.
=Average(): Just your regular average calculation (add up all numbers, divided by how many numbers there are).
In this case, the numbers aren’t too different, so picking any of the two won’t give you wildly different forecast results. In this case, because I know that there are unrepeatable sales events such as the 2.06% conversion rate on January 4th, I’m going to use the TrimMean. This means that in my forecast, I’ll be using the data in Column A to carry across my future sales forecast, which I’ll do in my next step.
Before that, let’s calculate some numbers on what it would take to reach the goal we set up for this period:
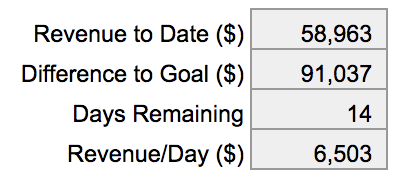
Revenue to Date: This is how much in total sales we’ve generated to date (carried over from the running total in Cell P18).
Difference to Goal: Subtracting our sales to date from our goal amount of $150,000, we still have $91,037 left to sell.
Days Remaining: We set our reporting period for 4 weeks, so if today is January 14th, then we only have 14 days left before January 28th.
Revenue/Day: In order to hit our goal, we need to sell $91,037 in the next 14 days. That’s about $6,503 in sales per day.
STEP 4: Calculate where you’re actually trending to hit, and what you really need to be selling in order to hit your goal.
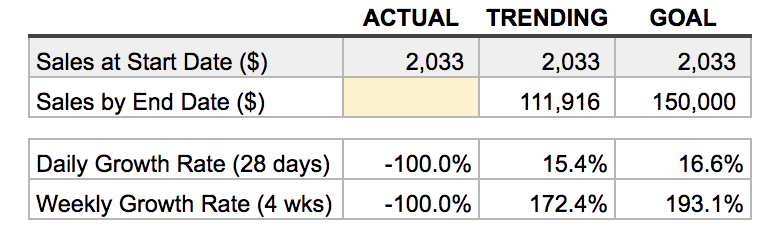
Trending (Rows 35-41): This is how much we’ll sell if we keep doing the same things we’ve done in the past. Based on Step 3, we will carry the TrimMean numbers (13 units per day and 1,994 visitors per day) across the rest of the upcoming two weeks. To do this, we will anchor the TrimMean cells (C24, C25, C26) to our forecasting table, and then copy and paste these same numbers across all future dates:
Looking at the “Trending” forecast, we’ll end the period with $111,916 in sales, which does not meet our $150,000 goal. This helps us understand that we need to somehow boost our sales in order to meet our goal.
Goal (Rows 43-49): In Step 3, we calculated that we need an additional $6,503 per day in sales in order to reach our goal. In order to achieve that, we will need to sell 22 units at $299 each. Doing some reverse calculation, we can figure out how much site traffic we need to drive in order to sell 22 units a day:
If we could drive 3,452 visitors and assuming they converted at an average of 0.63% on the page, we could sell 22 units per day and reach our $150,000 goal.
Difference (Row 51): Now let’s calculate exactly how much we’re short of traffic and sales. Based on what we’re selling now and where we need to be, it appears we need 1,458 more visitors per day in order to drive an incremental 9 units of sales per day.
Assuming that I am running Facebook ads, I could do a simple calculation as such: While it’s not always correct to assume that your cost-per-click for any digital ads platform will scale up linearly, this is a great way to provide a ballpark budget to your team. Instead of going to your head of finance and asking for as much money as possible, you could say, “Hey, I think we’re getting a pretty good return on our ad spend, so we should increase our daily ads budget by $700.”
STEP 5: Most people stop after filling out the forecast and consider it an idle spreadsheet, but in order to make this spreadsheet actionable, you should visualize the magnitude of the difference, and draw actionable insights.
First, let’s start by determining what kind of growth rate we’re seeing day-to-day, and week-to-week. Eventually, you could build a monthly and yearly forecast. These will be the numbers that your stakeholders care most about.
Growth rates tell you how much your sales are growing per interval of time, based on where you’re at in the beginning of the period and where you net at the end. Use these growth rates to set goals and show your investors how well you’re doing in the short-term:
Daily Growth Rate: You started with $2,033 of sales, and plan to sell $111,916 by the end of the period–this means that you increased sales by 15% each day across all 28 days.
Weekly Growth Rate: An increase from $2,033 of sales to $111,916 at the end of the 4th week means you grew sales by 172.4% per week, across 4 weeks.
Note: The “Actual” column growth rates will be filled in when the period comes to an end and you fill in the actual sales data from the past 4 weeks. These fields will calculate the growth rates on your actual sales.
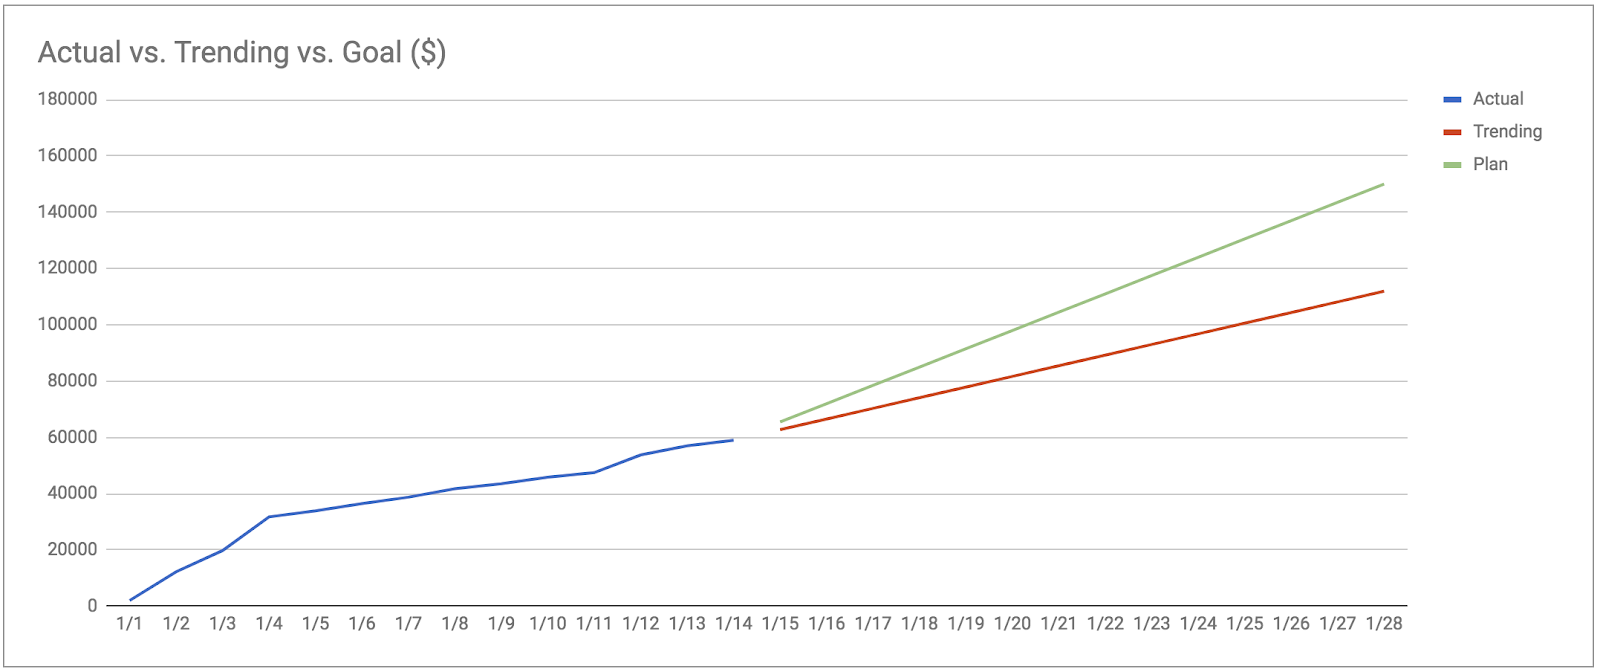
Lastly, let’s plot these numbers and see how we’re trending:
Actual (blue): This line represents how much we’ve actually sold to date. As you fill out the forecast, this graph will populate so you can see how much you’re beating or missing your expected sales plan.
Trending (red): This is how much we’ll sell if we keep up what we’re currently doing. You’ll notice it’s very similar to the blue line, because it’s an extension of what we’re doing right now.
Plan (dotted, green): This is where we want to be in order to hit our goals. This line is higher than what we’re predicted to sell right now (red line).
And that’s it! You can draw a variety of insights based on the numbers you see, that you can use to inform your marketing and pricing strategies. I’ve included some examples of insights you can glean from this forecast (Row 92).
What’s next
Remember that with hardware sales, especially with a few SKUs to start, you’ll face more seasonality and outlier data compared to other types of companies. For example: when selling on Amazon, there are certain product categories where looking at December sales history is not going to help you forecast how many units you’ll sell in January. Or, if you’re selling a pair of ski goggles, you’ll likely find that November is much better month than June. You’ll need to factor these seasonal trends into your forecast. In this case, website traffic is not the best metric to use.
Eventually, you’ll need to track many, many different channels. You could be selling in over 10 different offline channels and 20 different e-commerce marketplaces at the same time. For hardware startups, the initial P.O. (purchase order) will often be modestly sized, with massive orders for thousands of units coming in later in the year. Within a few month’s time, many retail channels could be shut down, or you could have opened new ones. That’s why it’s important to regularly update the assumptions of your forecast.
Regardless of the channel or number of products you’re tracking, just remember to keep it simple, bottoms-up, and actionable. Separate the forecasts for each channel if you need to–the more lines you can build in with different concrete assumptions, the more accurate your forecast will be.
This essay originally appeared in Hardware Massive Resources.
A brief intro to “pricing”
You’ve seen “Early Bird Prices” offering 50% discounts for consumer hardware products that are on the cusp of launch. As you browse Amazon in any given category, such as drones, you will see a variety of products with similar specs, but available at a wide spectrum of prices. So, how does any company decide what their product is worth to a customer?
I work at Indiegogo, a crowdfunding platform for new hardware products, and my job is to advise entrepreneurs on their launch strategy. Pricing is a key component of that conversation:
Product Price x Units Sold = Total Sales
The total amount of funds raised is the center of success for a pre-order campaign, because it reflects sales volume, which demonstrates market demand for a product. These funds also provide capital to build a business with. The higher the total funds raised, the more successful a product is.
Word on the street is that pricing as low as possible is critical to selling as many units as possible. Low prices are used as an incentive to consumers, to convince them to buy here and now. But, lowering prices does not always make sense if it results in inadequate funds for production, or if it does not match the positioning in the market.
This article takes a practitioner’s approach to pricing, focused on what’s profitable and feasible, rather than on pricing theory. The best place to start your pricing decisions is based on your own operations and customers.
Your price should mirror your product positioning
Pricing is not always about covering costs of production. At the core of your pricing decision should be identifying which set of customers will ultimately be your paying customers.
These are some types of pricing that might be applicable for your new product launch:
Price point
$
$$
$$$
$$$
Pricing type
Economic efficiency
Market penetration
Premium
Monopolistic
Example of situation to use
I can produce and distribute this product at a much lower price that my competitors, and match or better their quality.
I want to get this new product into the hands of as many customers as possible. I might be able to recoup margin through value added services, subscription fees, accessories, repeat purchases, or volume.
Customers have trust issues with product quality in this category, and my product promises reliable and transparent practices. We sell more than just a product.
My product’s core technology is unreplicable and patented, so we are the only company who can offer this product.
Common mistake #1: I want to sell as many units as possible, so I will adopt a “low price strategy” for my product.
This is always going to be a mistake for your bottom line. You will not leave enough margin for yourself to effectively pay for marketing and growth efforts, and there will be operational costs that you can’t anticipate right way. During your customer servicing, you might have shipped a product late to a customer, and the customer may want a refund because of the delay. Or, after the product is shipped, the customer may not want the product anymore. Returns are something you won’t be able to accurately anticipate, and will impose financial loss for you. There are other costs that you may not be able to forecast, such as credit card chargebacks, or a shipping price spikes from your service provider.
As a baseline, think of the 20/80 rule: your product should cost 20% of the selling price. Mark up your product 4x to start, and start whittling down your price from there. Keep reading for my take on how to build up your cost spreadsheet below.
Common mistake #2: I have a premium product in a new category, so I can charge a high price point and customers will understand why.
Premium positioning is not achievable right off the bat – it usually requires extensive user education through awareness campaigns to make it happen (this awareness can be driven by the industry at large, by influential parties, or paid for by your own marketing campaigns). Companies who may succeed with this type of pricing strategy are those who are offering an innovative product with massively improved user experience in an existing category, or they are carving out an entirely new category. However, this doesn’t always work, as the customers must be willing to pay comparable sums for substitute experiences.
Let’s imagine that you invented the first robot that can help you fold your laundry at home, and you want to charge $10,000 per unit. Unless you are substituting a service that is worth that amount, or unless customers understand exactly how easy it is to use this product and can imagine how much value this laundry-folding machine will bring to them, you can’t necessarily offer this price to consumers. This will take a lot of convincing through videos, demonstrations, and third-party validation to get the word out, and showcase to users why they would pay the equivalent price of a car for this robot.
Common mistake #3: I will sell my hardware for a really low price, and then make my money by selling the software or monetizing my app.
Think twice about this strategy. Unless the app experience is providing a core feature for the product, it will be hard to monetize the app. In the case of a home security camera, you won’t want to charge much of a premium on top of data storage costs that you’ll incur, since it will make your product unappealing. If you’re selling an IoT wearable product that unlocks gamification features through the app, you may want to rethink the value that is really being offered through the software.
As corny as it sounds, think of this as as analogous to selling pizza: you won’t convince a user to pay for features that they don’t want, just as someone won’t come in and add extra toppings if they don’t want to eat it.
Building your cost spreadsheet
A common mistake that hardware teams make when looking at costs is not accounting for operational and marketing costs. These calculations should be built into your retail price calculation, as these are the funds you will need to continue to grow your business.
Here’s are some of the items you should be aware of that will cost you money. As an example, we’ll imagine that this is the cost spreadsheet for a wireless earbud product that retails for $100:
Wireless earbuds ($100 MSRP)
Type of cost
What this includes
Expected margin cost
Dollar cost
COGS (Cost of Goods Sold)
BoM (Electronic, mechanical bill of materials), including the cost of components and assembly costs. Don’t forget to factor in your fixed costs for tooling and production, especially if it’s your first run and you are cash-tight.
20-30%
$20
Shipping & logistics
Costs associated with warehousing your product, forwarding your freight to warehouses, shipping products from your production port to your destination, and shipping to customers’ doors.
10-20%
$10
Channel margin
These are the fees you will pay to your channels of distribution, whether it’s third party sales distributors, offline retail stores, or online retail stores.
Variable based on product category and channel (Example: typically 10-20% for online retail, and 30%-50% for offline retail.)
$20
Marketing margin
What you will pay via direct marketing or overall cost to invest in marketing your product. For example, it might cost you
15-25%
$20
For this wireless earbud product sold at $100, subtracting all of the costs above, the company can expect to net a gross margin of $30 per pair sold, which equals a 30% gross margin:
Maintaining a 30% gross margin per unit is a great path toward profitability, as there will be other costs incurred as part of the business. This can include hiring new talent, paying office rent, and more.
Offer sensible disounts
So now that you’ve got an idea of what price to set for your product, how do you know when and how much to discount?
Discounting is a bit of an art. Once you’ve accounted for your core costs of business, it’s a matter of making sure that your discounts are valuable to the right people, at the right time. Let’s say that you’re selling a connected ski goggle: you’ll probably anticipate an increase in demand during snow season in December, or when people are planning to ski. Based on that, it might make sense to discount the product to incentivize purchases during the winter season. It may be tempting to discount on Mother’s Day, Independence Day, and every major shopping event, but you should avoid discounting too frequently, or else you’ll train your potential customers to undervalue your product.
Here are some basic principles to consider when deciding when and how much to discount:
Pricing factors
Why this matters
Considerations
Your customer’s price elasticity
Will your customers care if your price is lowered, or does it not impact their purchase decision?
There are some product categories where dropping the price doesn’t necessarily incentivize someone to complete the purchase. A good example of this is a refrigerator, a product that you only need to purchase once every few years, so regular discounts don’t make sense.
Frequency of discounting
Seasonality is a big factor for many products. Think about which holidays and market penetration opportunities you have to drive up order volume with promotional incentives.
Don’t provide huge price cuts regularly. It’s tempting to lower the price every holiday. Instead, consider offering free accessories, and save big discounts for big holiday pushes, like Black Friday, or another relevant season for you.
Tradeoff between margin and volume
Lowering your price can bring you bigger boosts in sales volume, but at a trade-off of how much cash you can take home.
For any discounting in which you’re going to break even (i.e. not make any money, but not lose money either), be sure that you’re pursuing a worthwhile opportunity. Once you set a low price, it will be tracked online in articles and on deal sites, which will make it harder to increase the price later on.
Final thoughts
We’ve gone through and covered the basics of what to consider when setting your price, how to build up your cost spreadsheet, and then when to change the price for customers.
The above materials are great to consider when you’re presenting a price to consumers, but distributor and B2B pricing (where your customers are businesses) is going to be more complex. Where pricing gets challenging is factoring in the intangibles, such as the marketing value that a third-party channel might bring in, or access to a specific group of customers with a specific retailer. You may consider offering a better price to different partners based on the value they can bring to your brand.
My best advice to you is to experiment with price points, but remember not to sell yourself short. You’ve got a long-term business to build, and you will need the right amount of capital to reinvest into it.
Pricing isn’t just about making money for your business–it plays into the market positioning of your product as well. If you find that you aren’t able to sell units, try to adjust the price as a lever for marketing optimization. Often, consumer hardware can just be too expensive for mass consumers, or the price point isn’t right for a specific audience. Always talk to your customers and see who your paying customers are, so that you can adjust your product for them. Sometimes, it might mean going back to your manufacturer and working on a cost-down plan so that you can lower the price and sell ten times more units.